Displaying a Pie Chart of Items per Category in Angular using Business Central API
Backend Preparation
To extract the necessary data from Business Central, we will use the following query which fetches item categories and their respective cost amounts:
1
2
3
4
5
6
7
8
9
10
11
12
13
14
15
16
17
18
19
20
21
22
23
24
25
26
27
28
29
30
31
32
33
34
35
36
37
38
39
40
41
query 50000 "Item Category by Item"
{
    APIGroup = 'hector';
    APIPublisher = 'im';
    APIVersion = 'v1.0';
    EntityName = 'itemCategorybyItem';
    EntitySetName = 'itemCategoriesbyItem';
    QueryType = API;
    DataAccessIntent = ReadOnly;

    elements
    {
        dataitem(itemCategory; "Item Category")
        {
            column(code; "Code") { }
            column(description; Description) { }

            dataitem(item; Item)
            {
                DataItemLink = "Item Category Code" = itemCategory.Code;
                SqlJoinType = InnerJoin;

                dataitem(valueEntry; "Value Entry")
                {
                    DataItemLink = "Item No." = item."No.";
                    DataItemTableFilter = "Item Ledger Entry Type" = FILTER(Purchase | Transfer);
                    SqlJoinType = InnerJoin;

                    column(costAmountActual; "Cost Amount (Actual)")
                    {
                        Method = Sum;
                    }
                    column(costAmountExpected; "Cost Amount (Expected)")
                    {
                        Method = Sum;
                    }
                }
            }
        }
    }
}
The JSON response from this query looks like this:
1
2
3
4
5
6
7
8
9
10
11
12
13
14
15
16
17
18
19
20
21
22
23
24
25
26
27
28
29
30
31
32
33
34
35
36
37
38
39
40
41
{
    "@odata.context": "/v1.0/$metadata#companies()/itemCategoriesbyItem",
    "value": [
        {
            "code": "BEANS",
            "description": "Beans",
            "costAmountActual": 0,
            "costAmountExpected": 125495
        },
        {
            "code": "ESCRITORIO",
            "description": "Surtido mesas",
            "costAmountActual": 81245.1,
            "costAmountExpected": 0
        },
        {
            "code": "GRANOS",
            "description": "Granos",
            "costAmountActual": 0,
            "costAmountExpected": 25000
        },
        {
            "code": "MESA",
            "description": "Mesa oficina",
            "costAmountActual": 144366.4,
            "costAmountExpected": 0
        },
        {
            "code": "SILLA",
            "description": "Silla oficina",
            "costAmountActual": 165891.9,
            "costAmountExpected": 2115.4
        },
        {
            "code": "VARIOS",
            "description": "Varios",
            "costAmountActual": 149888.4,
            "costAmountExpected": 0
        }
    ]
}
Angular Frontend Setup
Step 1: Define Classes and Interfaces
First, create the ItemCategoriesByItem class to store the data:
1
2
3
4
5
6
7
8
9
10
11
12
13
14
15
16
17
18
19
export class ItemCategoriesByItem {
    code: string;
    description: string;
    totalQuantity: number;
    totalCost: number;

    constructor(code: string, description: string) {
      this.code = code;
      this.description = description;
      this.totalQuantity = 0;
      this.totalCost = 0;
    }

    addItem(quantity: number, costAmountExpected: number, costAmountActual: number) {
      this.totalQuantity += quantity;
      this.totalCost += costAmountExpected;
      this.totalCost += costAmountActual;
    }
}
Create an interface for the items:
1
2
3
4
5
6
export interface Item {
    code: string;
    description: string;
    costAmountActual: number;
    costAmountExpected: number;
}
Step 2: Store API Data in Component Variables
In your user component, define arrays to store the data:
1
2
3
labels: string[] = [];
series: any[] = [];
labelsName: any[] = [];
Step 3: Fetch Data from API
Add a function to fetch and process the data from the API:
1
2
3
4
5
6
7
8
9
10
11
12
13
14
15
16
17
18
19
20
21
22
23
24
25
26
27
28
29
30
31
32
33
34
35
36
37
38
39
40
41
42
43
44
45
getItemCategoriesByItem() {
    const categories: { [key: string]: ItemCategoriesByItem } = {};
    this.loginService.getData('/itemCategoriesbyItem', '')
      .subscribe(
        data => {
          data.value.forEach((item: Item) => {
            if (!categories[item.code]) {
              categories[item.code] = new ItemCategoriesByItem(item.code, item.description);
            }
            categories[item.code].addItem(item.quantity, item.costAmountExpected, item.costAmountActual);
          });

          for (const key in categories) {
            if (categories.hasOwnProperty(key)) {
              this.labels.push(categories[key].description);
              this.series.push(categories[key].totalCost);
            }
          }

          this.userData.value[0].series = this.series;
          this.userData.value[0].labelsName = this.labels;

          const labelsTotal = this.series.reduce((total: number, serie: number) => total + serie, 0);
          this.userData.value[0].labels = this.series
                      .map((serie) => {
                          const percentage = Math.round(serie / labelsTotal * 100);
                          return percentage !== 0 ? percentage + '%' : '';
                      });

          const emptyPositions = this.userData.value[0].labels
                      .map((label, index) => label === '' ? index : -1)
                      .filter(index => index !== -1);

          emptyPositions.reverse().forEach(position => {
                        this.userData.value[0].series.splice(position, 1);
                        this.userData.value[0].labelsName.splice(position, 1);
                        this.userData.value[0].labels.splice(position, 1);
                      });

            console.log(this.userData.value[0].labels);

          this.route.navigate(['home'], { state: this.userData });
        },
      );
}
Just note that we are navigating to the home component, that’s the component where we are going to display the chart.
Step 4: Dispaly Data in Home Component
In the home component, display the user data that we have previously loaded:
1
2
3
4
5
6
7
8
9
10
11
12
13
14
15
16
ngOnInit() {
    //Graph1 => Pie Chart
    this.userData = history.state;
    this.emailChartData = {
      labels: this.userData.value[0].labels,
      series: this.userData.value[0].series,
      labelsName: this.userData.value[0].labelsName.filter(labelName => labelName !== '')
    }

    const colors = ['fa fa-circle text-info', 'fa fa-circle text-danger', 'fa fa-circle text-warning', 'fa fa-circle text-custom-purple', 'fa fa-circle text-success', 'fa fa-circle text-primary'];

    this.emailChartLegendItems = this.emailChartData.labelsName.map((labelName: string, index: number) => ({
      title: labelName,
      imageClass: colors[index % colors.length]
    }));
}
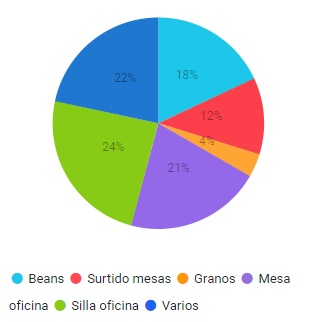
With these steps, you should be able to successfully display a pie chart of items per category in your Angular application using data from the Business Central API.